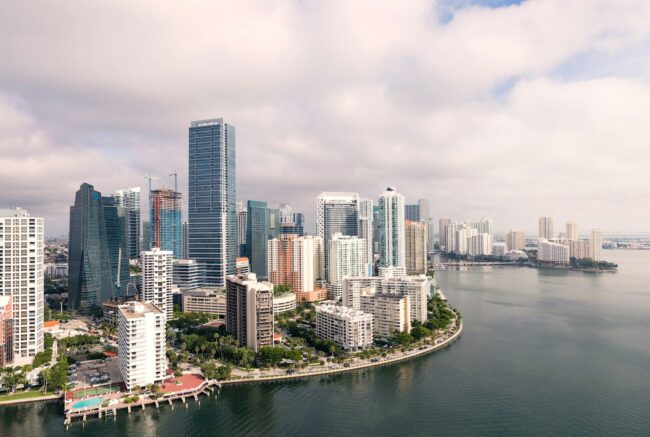
Miami, Florida skyline. Photo: Wilfredor via Wikimedia Commons, CC0 1.0 Universal Public Domain Dedication.
Quick Answer
Miami-Dade’s 2026 preliminary taxable value reached about $540.1 billion, up 5.4% from 2025, according to the county Property Appraiser’s July 1 roll. Market (just) value on the real estate roll rose only 0.65%, so most of the taxable growth came from capped assessments catching up to market value, plus $7.1 billion of new construction.
What Did Miami-Dade’s 2026 Tax Roll Show?
Every July 1, the Property Appraiser of Miami-Dade County certifies a preliminary assessment roll to the county, its municipalities, the school board and special districts. That roll is the starting point for every property tax budget in the county for the coming fiscal year, and it is one of the cleanest public data sets on how the local economy is actually performing on the ground.
The 2026 preliminary roll, dated July 1, 2026, puts countywide taxable value at $540,137,256,145, up from a final 2025 figure of $512,351,556,115. That is an increase of about $27.8 billion, or 5.4%. New construction accounted for $7,104,154,372 of the taxable total.
Those headline numbers include every category the appraiser values. The real estate roll alone, which the appraiser breaks out by property type, shows the more interesting story: a market that has gone flat in value terms while the tax base keeps growing.
How Much Did Market Value Change?
On the real estate roll, total just value (the appraiser’s estimate of market value as of January 1) was $768.43 billion in 2025. For 2026, the figure is $773.40 billion including new construction, a gain of just 0.65%.
Strip out new construction and the picture flips. Existing real estate was valued at $765.82 billion, down 0.34% from a year earlier. In plain terms, the buildings and land that were already on the roll in 2025 were worth slightly less on January 1, 2026, than they were a year before. Only the addition of newly completed projects pushed the total higher.
Why Did Taxable Value Rise So Much Faster?
Real estate taxable value climbed from $491.10 billion to $517.48 billion, a 5.37% increase including new construction and 3.93% without it. The gap between a flat market and a rising tax base comes largely from Florida’s assessment limits.
Under Save Our Homes, the assessed value of a homesteaded property can rise each year by no more than 3% or the change in the Consumer Price Index, whichever is lower. The Martin County Property Appraiser reports that the 2026 cap is 2.7%, set by CPI, after a 2.9% cap in 2025 according to the Miami-Dade Property Appraiser. When market values sit well above capped assessed values, assessed values keep rising toward the market even in a flat year.
The roll shows that convergence clearly. In 2025, real estate taxable value equaled about 63.9% of just value. In 2026, the ratio rose to about 66.9%. Owners did not see their homes appreciate much, but a larger share of that value is now exposed to taxation.
Which Property Types Gained and Which Lost?
The property-type breakdown is where the 2026 roll becomes useful for business planning. It separates condos from single-family homes, commercial from industrial, and shows the role of new construction in each.
Miami-Dade 2026 Preliminary Real Estate Roll by Property Type
| Property type | 2025 just value | 2026 just value (incl. new) | Just value change | Taxable value change |
|---|---|---|---|---|
| Single family | $298.92B | $305.27B | +2.12% | +7.71% |
| Condos and co-ops | $194.38B | $192.73B | -0.85% | +4.12% |
| Multifamily (under 10 units) | $22.13B | $22.31B | +0.82% | +7.18% |
| Multifamily (10+ units) | $38.04B | $38.81B | +2.03% | +3.37% |
| Commercial | $87.76B | $86.00B | -2.01% | +1.54% |
| Industrial | $45.81B | $46.68B | +1.91% | +8.73% |
| Agriculture | $8.07B | $8.41B | +4.21% | +5.26% |
| Vacant land | $27.55B | $26.80B | -2.72% | +5.93% |
| Total real estate | $768.43B | $773.40B | +0.65% | +5.37% |
Source: Property Appraiser of Miami-Dade County, 2026 Preliminary Assessment Roll Change by Property Type Including New Construction, July 1, 2026.
Are Miami-Dade Condo Values Falling?
Yes, on the appraiser’s numbers. Condos and co-ops were valued at $194.38 billion in 2025 and $192.73 billion in 2026 including new construction, a 0.85% decline. Excluding new construction, existing condo just value fell 2.21%, to $190.08 billion.
That decline is notable because condos still added the most new construction value of any category: $2.66 billion of just value, about 35% of the county’s real estate new construction. New towers are still being delivered and placed on the roll even as the value of the existing condo stock slips.
Taxable value for condos still rose 4.12%, to $157.20 billion. That again reflects capped assessments moving up toward market value rather than any increase in what the units would sell for.
How Did Single-Family Homes Perform?
Single-family homes remain the largest single category, at $305.27 billion of just value in 2026. They gained 2.12% including new construction and 1.42% without it, meaning existing houses held their value modestly better than condos.
Taxable value for single-family homes rose 7.71%, the second-largest taxable increase among the major categories, adding roughly $12.2 billion to the taxable base. New single-family construction added $2.09 billion of just value.
What Happened to Commercial Property?
Commercial real estate, which includes office, retail and hotel property, lost value. Just value fell from $87.76 billion to $86.00 billion including new construction, a 2.01% decline, and dropped 2.93% excluding new construction. New commercial construction added $813 million of just value, about 11% of the countywide total.
Commercial taxable value rose only 1.54%, the smallest gain among the large private-sector categories. Non-homestead property does not benefit from Save Our Homes, so commercial assessments track market value more closely, and a falling market shows up more directly on the taxable line.
Why Is Industrial the Standout?
Industrial property is the strongest performer on the 2026 roll by taxable growth. Taxable value rose 8.73% including new construction and 8.14% without it, reaching $37.45 billion, an increase of about $3.0 billion. Just value rose 1.91%, to $46.68 billion.
The strength also shows up in the municipal data: Medley, a heavily industrial town in the northwest of the county, posted a 7.9% gain in taxable value, to $7.02 billion.
What Does the Vacant Land Line Say?
Vacant land carries a negative new construction figure: minus $234 million of just value. When a parcel moves from vacant land to a built property type, its value leaves the vacant land category, and the appraiser records the shift as negative new construction there. The number is a small signal of land being absorbed into development.
Which Cities Added the Most Taxable Value?
The roll by taxing authority shows how growth is distributed across the county’s municipalities and the unincorporated area.
Largest Miami-Dade Taxing Authorities, 2026 Preliminary Roll
| Taxing authority | 2025 taxable value | 2026 preliminary | Change | New construction |
|---|---|---|---|---|
| Unincorporated | $135.44B | $143.90B | +6.2% | $1.54B |
| City of Miami | $103.71B | $110.12B | +6.2% | $3.30B |
| Miami Beach | $60.30B | $62.39B | +3.5% | $539M |
| Coral Gables | $26.01B | $27.72B | +6.6% | $266M |
| Hialeah | $22.18B | $23.52B | +6.1% | $178M |
| Doral | $21.88B | $22.66B | +3.6% | $4M |
| Sunny Isles Beach | $19.11B | $19.50B | +2.0% | $117M |
| Aventura | $14.19B | $14.30B | +0.8% | $7M |
| Key Biscayne | $11.71B | $12.30B | +5.1% | $68M |
| Miami Gardens | $9.62B | $10.08B | +4.8% | $6M |
| Countywide | $512.35B | $540.14B | +5.4% | $7.10B |
Source: Property Appraiser of Miami-Dade County, 2026 Preliminary Roll by Taxing Authority, July 1, 2026.
Why Does the City of Miami Matter So Much?
The City of Miami recorded $3.30 billion of new construction on the 2026 preliminary roll. That is about 46% of the county’s entire $7.10 billion of taxable new construction, coming from one municipality. Unincorporated Miami-Dade, by comparison, added $1.54 billion, about 22%.
The concentration shows where large-scale building is landing on the roll: completed projects enter at full value in their first year, and in 2026 the largest share of that value sat inside Miami city limits. The city’s taxable value rose 6.2%, to $110.12 billion.
Which Coastal Condo Cities Lagged?
The weakest growth among the large municipalities came from condo-heavy coastal cities. Aventura gained just 0.8%, to $14.30 billion. Sunny Isles Beach rose 2.0%, to $19.50 billion. Miami Beach rose 3.5%, to $62.39 billion. All three are below the 5.4% countywide rate.
That lines up with the property-type data showing condo just value declining. Cities whose tax base is dominated by existing condominium towers have less room for growth when that market is soft, and they had relatively little new construction to offset it.
Which Places Grew Fastest?
At the top of the percentage rankings, Florida City posted an 11.4% gain, to $1.72 billion, supported by $188 million of new construction. Indian Creek rose 10.4%, Biscayne Park 9.9%, Opa-locka 9.5% and South Miami 8.6%. Among the larger cities, Pinecrest gained 6.7% and Coral Gables 6.6%.
What Is the Typical Residential Value in Miami-Dade?
The appraiser’s 2026 preliminary report on average and median residential values covers 785,283 residential properties countywide. The report shows a countywide average just value of $634,171 and an average taxable value of $417,111. The median just value is $415,141 and the median taxable value is $249,022.
The difference between average and median reflects the weight of high-value properties at the top of the market. The gap between just and taxable value reflects homestead exemptions and Save Our Homes savings.
Residential Values in Selected Cities, 2026 Preliminary
| Area | Residential properties | Average just value | Median just value |
|---|---|---|---|
| Countywide | 785,283 | $634,171 | $415,141 |
| City of Miami | 105,378 | $675,025 | $450,480 |
| Miami Beach | 49,513 | $1,182,155 | $391,186 |
| Coral Gables | 16,524 | $1,894,485 | $1,175,417 |
| Key Biscayne | 7,053 | $2,003,565 | $1,163,430 |
| Doral | 23,632 | $497,876 | $445,000 |
| Hialeah | 51,551 | $358,657 | $364,040 |
| Homestead | 21,160 | $317,251 | $310,000 |
| Unincorporated | 330,229 | $481,635 | $418,873 |
Source: Property Appraiser of Miami-Dade County, 2026 Preliminary Average and Median Residential Values, July 1, 2026.
Miami Beach stands out for the gap between its average ($1.18 million) and median ($391,186), which points to a market where a smaller number of very high-value properties pull the average far above the typical home. Coral Gables and Key Biscayne carry median values above $1.1 million.
What Does This Mean for Miami Businesses?
For business owners and commercial landlords, the 2026 roll carries several practical signals.
First, commercial property is the one major private category where both market and taxable value are under pressure. Commercial owners do not get Save Our Homes protection, so a falling market should translate more directly into assessments. The 2026 roll shows commercial taxable value growing only 1.54%, well below the county average.
Second, industrial property owners are seeing the opposite. An 8.73% taxable increase means higher tax bills are likely for warehouse owners, and under net leases those costs can pass through to tenants.
Third, the residential numbers show a homeowner base whose taxable values are rising faster than market values. That matters for consumer spending, because higher property tax bills on homesteaded and non-homesteaded homes alike compete with every other household expense.
When Do These Numbers Turn Into Tax Bills?
According to the Miami-Dade Property Appraiser, Truth in Millage (TRIM) notices go out each August, and property tax bills are mailed each November. The July 1 preliminary roll is the base that taxing authorities use to set millage rates in late summer, so the final bills arriving this month reflect the values described here and the rates each authority adopted.
Brian’s Take
What jumps out at me is the split between market value and taxable value. Real estate on the Miami-Dade roll was worth essentially the same on January 1, 2026, as a year earlier, and the existing stock was worth slightly less. Yet the taxable base grew more than 5%. When I looked at numbers like these as an analyst, the question was always whether the income behind an asset was keeping pace with its costs. For a lot of Miami property owners, the tax line is rising while the value line is not.
The condo numbers deserve attention. Existing condo just value fell 2.21% even while the county added $2.66 billion of new condo value. That is a lot of new supply arriving into a softening segment, and the coastal cities that depend most on condos, Aventura, Sunny Isles Beach and Miami Beach, all grew well below the county average.
On the other side, industrial is doing the heavy lifting, with taxable value up 8.73% and Medley up 7.9%. And one city, Miami, delivered nearly half of all new construction in the county. That tells me where capital has been going. For Florida business owners, this roll is a reminder to read the public data closely: the numbers are free, and they are honest about which parts of the market are working.
Frequently Asked Questions
What is Miami-Dade’s total taxable value for 2026?
The Property Appraiser’s July 1, 2026, preliminary roll lists countywide taxable value at about $540.1 billion, up 5.4% from about $512.4 billion in 2025.
Did Miami-Dade property values go up in 2026?
Barely. Real estate just value rose 0.65% including new construction. Without new construction, the value of existing real estate fell 0.34%.
Why are taxes rising if values are flat?
Capped assessed values are still catching up to market values. The Save Our Homes cap allowed homestead assessments to rise up to 2.7% for 2026, and the share of just value that is taxable rose from about 63.9% to 66.9%.
Which property type grew the most?
Industrial property posted the largest taxable gain among major categories, 8.73%, followed by single-family homes at 7.71%.
How much new construction was added?
About $7.1 billion of taxable new construction countywide. The City of Miami accounted for $3.30 billion of it, about 46%.
What is the median home value in Miami-Dade?
The 2026 preliminary report shows a countywide median residential just value of $415,141 across 785,283 residential properties.
Sources and Further Reading
- 2026 Preliminary Assessment Roll Change by Property Type Including New Construction, Property Appraiser of Miami-Dade County
- 2026 Preliminary Roll by Taxing Authority (July 1, 2026), Property Appraiser of Miami-Dade County
- 2026 Preliminary Average and Median Residential Values, Property Appraiser of Miami-Dade County
- Save Our Homes (Amendment 10), Property Appraiser of Miami-Dade County
- Save Our Homes 2026, Martin County Property Appraiser
About the Author